Any good homelab has an awesome dashboard setup to go with it, whats cooler than a web page full of graphs and numbers, I cant think of much.
But when I saw the most popular solution Grafana I nearly fainted reading guide after guide, each one more complicated than the next, all I really wanted was some simple stats on my web server where Grafana was installed and the network thorughput from my Sophos XG box which I knew I could get through SNMP, just how to put it into Grafana.
So lets start by installing Grafana, I will be using CentOS 7 but any RHEL bassed distro will be the same and I am sure if you modify some commands it will work in Debain bassed distros too, its really simple to install just run the following command
yum install https://grafanarel.s3.amazonaws.com/builds/grafana-3.1.1-1470047149.x86_64.rpm
then you can start the server with
systemctl start grafana-server
systemctl enable grafana-server
and your done, that was super duper easy, you can now go to your install at http://(server IP or hostname):3000 or do what I did and setup nginx to route to grafana this way you can use standard ports and have SSL support.
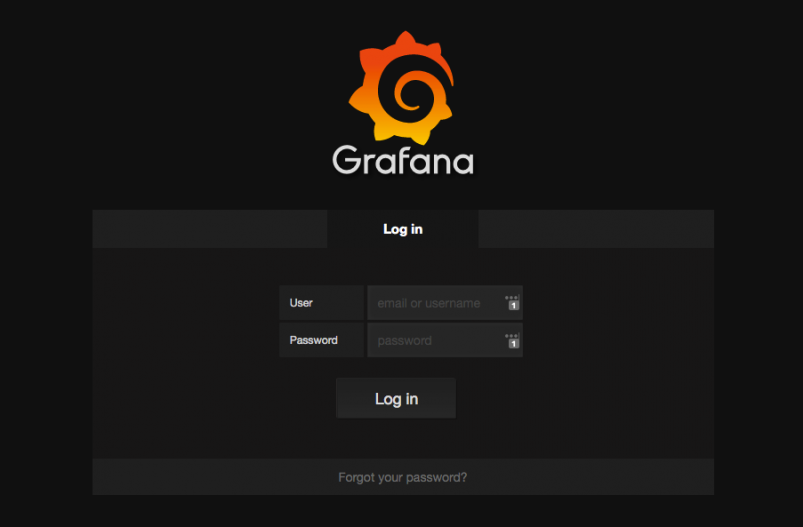
Now you will be greated with a fancy login/register page, you can login with the default user which has a username of admin and a secure password of admin be sure to change this to prevent anybody just loging in
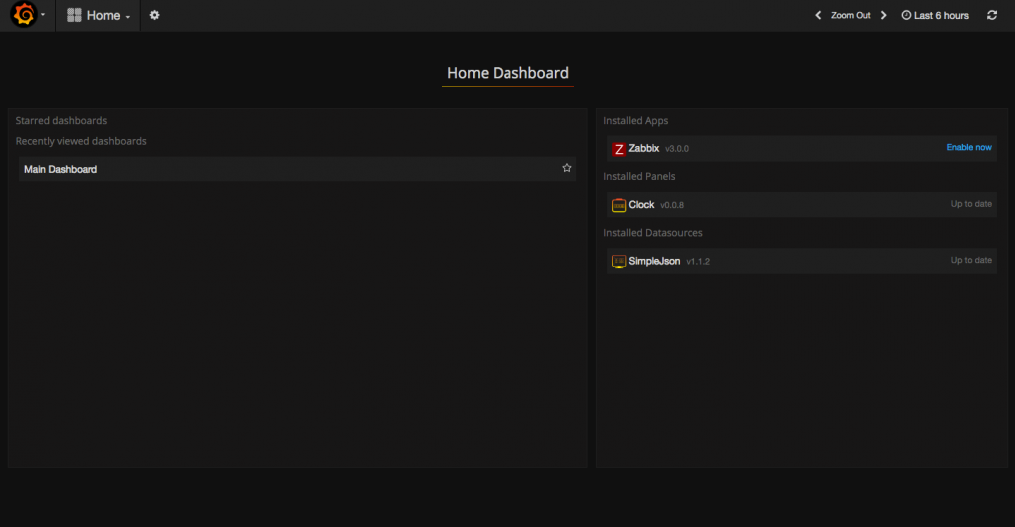
Once you log in you will be greated with the home dashboard which has two columns on the left you have a list of your dashboards and on the right you have a list of plugins installed, for a fresh install these will both be blank but as you can see I have one dashboard and some plugins on my system but we wont need any of these plugins for this gguide.
Ok so now you can go the the menu at the top which says home and create a new dashboard, ready for adding a bunch of widgets, once created you will be greated with a mostly blank page with a little green bar on the left and a add row button on the bottom but before we get carried away here you need to think about what data you want displayed and how you are going to feed it into grafana.
So I decided to installed collectd and influxdb on the server hosting grafana, collectd is an awesome tool which basicly queries servers for info and then feeds it all back to a database in our case influxdb as its what most people use and its very simple to setup, I feel this is a great combo for beginers as their really simple to setup and quite flexibile.
If you have the epel repo on your machine then you can simply do yum install collectd to install collectd
To install influxdb you need to manually install from an RPM file, I recomend you get the latest from the influxdb download page but as of wirting this is the install command with the latest RPM file
yum install https://dl.influxdata.com/influxdb/releases/influxdb-1.0.0.x86_64.rpm
Now that we have installed them lets start editing the config files and we will start by editing the config for collectd which is stored in
/etc/collectd.conf
So I started out by uncomenting
Hostname    "localhost"

FQDNLookup   true

BaseDir     "/var/lib/collectd"

PIDFile     "/var/run/collectd.pid"

PluginDir   "/usr/lib64/collectd"

TypesDB     "/usr/share/collectd/types.db"
I also uncomented the LoadPlugin lines for load, interface, network and netlink
Now you can go to the bottom of the file and add the following
<Plugin load>

        ReportRelative true

</Plugin>
Lets setup our first bit of data to start monitoring in this case we will start with the basic network adapter stats which is as simple as adding the folowing to your config file
<Plugin interface>

        Interface "eth0"

        IgnoreSelected false

</Plugin>
You can change the interface to the name of your network adapter if its not eth0
Ok so we got our data but we need to tell collectd where to send it and we do that with the network plugin like so
<Plugin network>

    Server "127.0.0.1" "28596"

</Plugin>
This will send all the data from collectd to our server at port 28596, now most guides do not use this port and I found that collectd did not send the data on the port most people use so switched to 28596
Now you can start and enable collectd like so
systemctl start collectd
systemctl enable collectd
Okay so now we can just setup influxdb so edit the config file which is in /etc/influxdb/influxdb.conf, if you are using nano you can do a search for colectd as the is a section in the config specificly for collectd how convinient
Simply change it to enabled and change the bind address so it looks like this
[[collectd]]

  enabled = true

  bind-address = "127.0.0.1:28596"

  database = "collectd"

  typesdb = "/usr/share/collectd/types.db"
now just start and enable the influxdb server like so
systemctl start influxdb
systemctl enable influxdb
if you go to your servers ip and port 8083 (do not make this public as it has no protection by default) you will see a fancy little web page generated by influx, if you change your database in the right corner to collectd and put show measurements into the text box you should see some tables like so
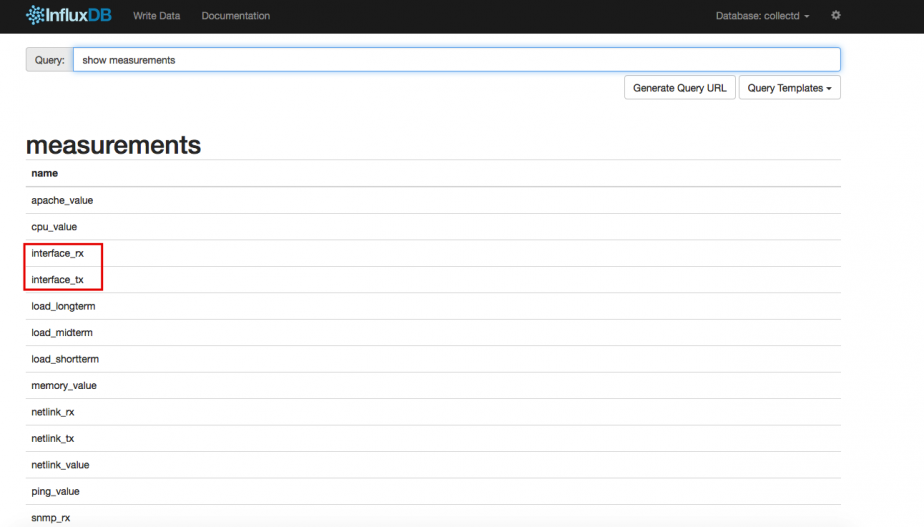
I have a lot more data in my table so dont be alarmed if you dont see some of the fields, but now you have data being saved in a database, now to just get grafana to display it, this has been very easy so far.
So in grafana go to the little logo in left corner and click data sources in the menu and you will get a page like this
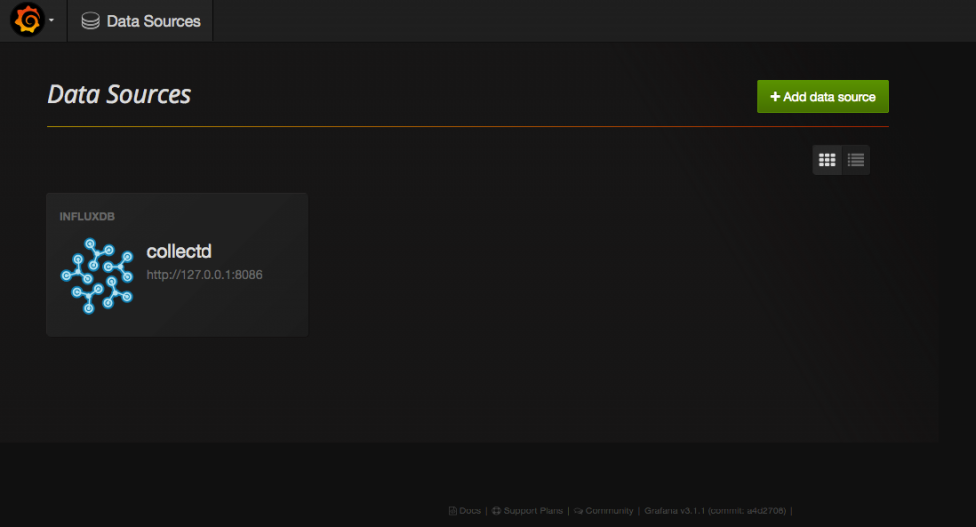
so click the big green add data source button and fill it out like below, the username and password are root/root again be sure not to make port 8086 or 8083 public as you dont want people having read/write access to your database over the internet
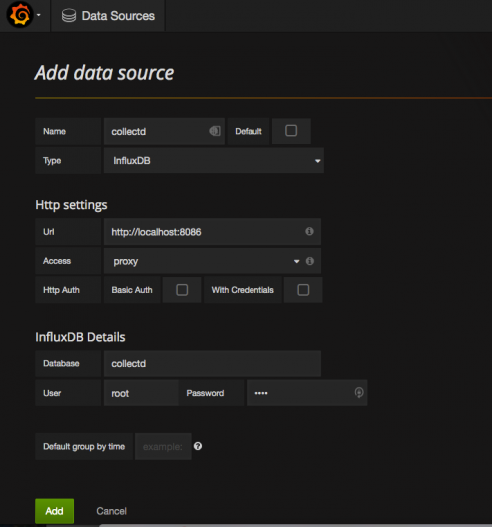
hit add and it will test your new data source, if you get a nice message saying your data source is working then your ready to start adding some panels to the dashboard you created at the start
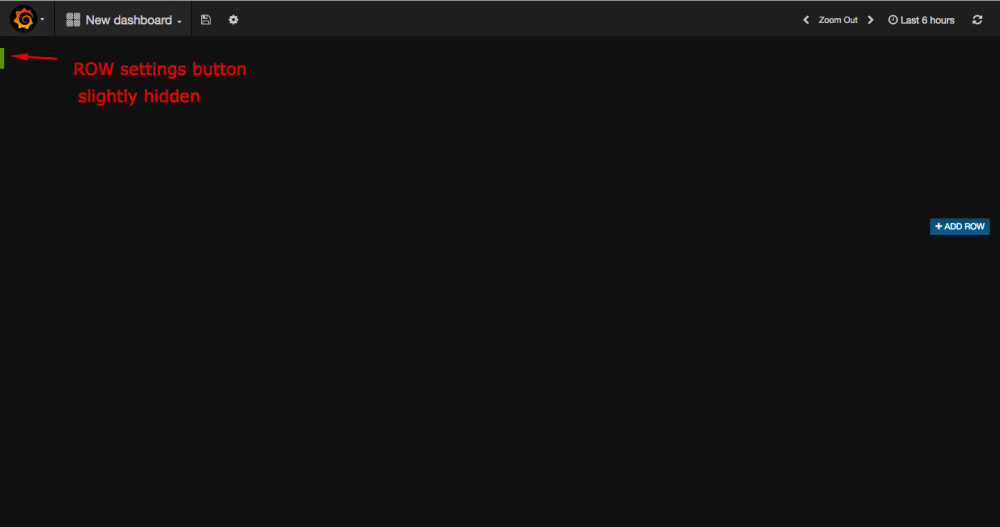
So every new dashboard comes with a single row, you can see where the rows are by the little green tabs on the left side which are quite invisible, but by clicking that you get the settings for that row including a button add a new panel, lets start with addiing a graph for our network usage.
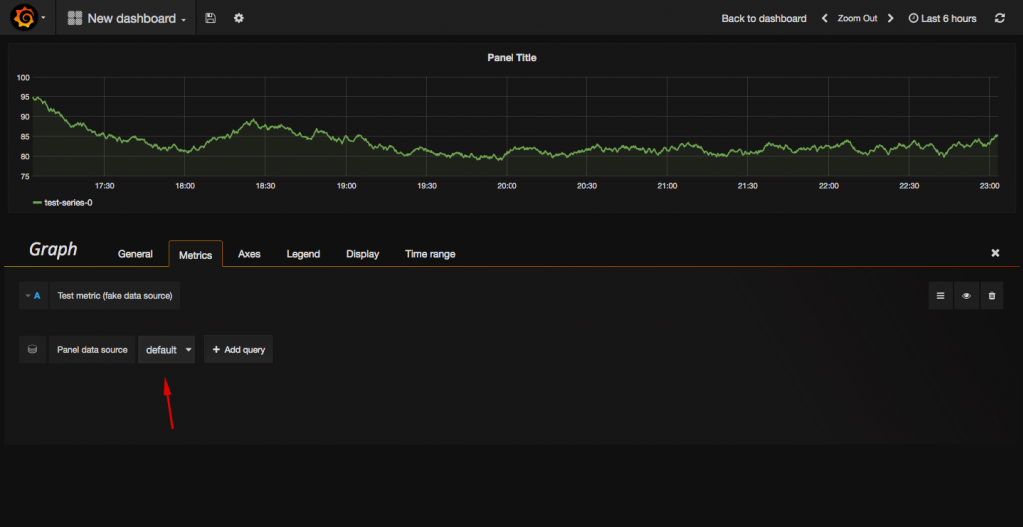
Now as pretty as the fake sample data is its not our network usage so click the panel data source tab and select collectd, now the graph is empty, but fear not thats simply because we have a blank query so grafana has no idea what data we are looking to display so lets fix that by adding a query at the top,
It adds a query by default so click it to open the query editor
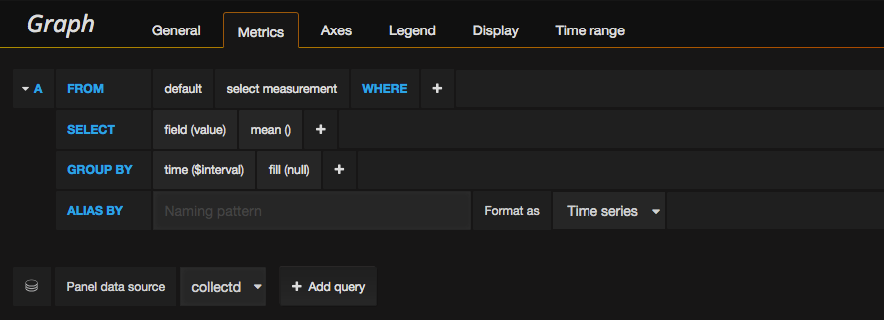
So if you change the query to use either interface_rx or interface_tx and select the right type and instance you should get this
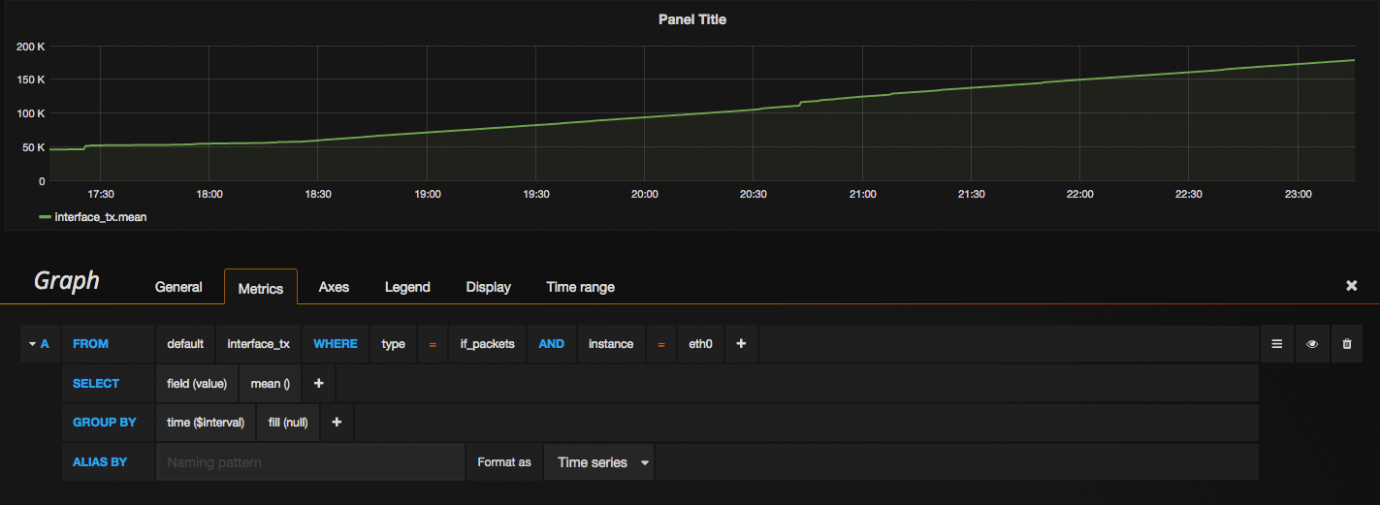
which is the data but its not correct as we are giving it a count of the packets but that number just always goes up, what we want is something where we can see spikes when the network is in use as in its current state its quite useless, unfortunetly the query editor does not support the right mode we need to display the data in this way so we will need to manually write out the query to do this click the little hamburger menu on the right side of the query and click togle edit mode, this will switch it from the gui interface to a simple text box with a query not to different from SQL.
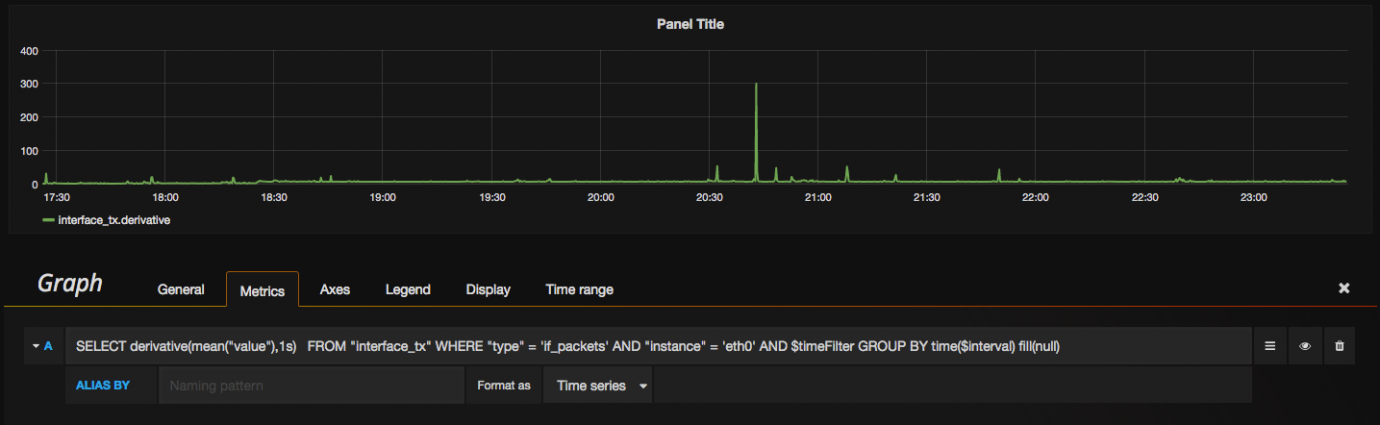
In our case the following query would give us this
SELECT mean("value") FROM "interface_tx" WHERE "type" = 'if_packets' AND "instance" = 'eth0' AND $timeFilter GROUP BY time($interval) fill(null)
Now all we need to do to get our data to display properly is to modify the part at the begining from mean("value") to derivative(mean("value"),1s) this will give us the correct values over time, now this is where I am kinda unsure on if I am getting the correct values from this, some people multiple the derivative line by 8 first but if anyone knows the correct line for packets per second then please let me know
but at the end of the day its still a great visulisation and I am pretty sure the data is correct but will be doing some tests and such when I get time to see how accurate it is and as you can see with that simple change we have a pretty flat line as my web server has very little usage
So now head over to the axes tab and change the the unit type for the left axis to data rates/packets per second and now it will show the right units in the left axis, you can also siwtch back to the metrics tab and if you click the query you can set an alias for that query so it has a proper name in the legand and on the hover over.
You can also add a second query, so I am going to add a second query for RX data as well so just click the add query button and copy the query for TX and change tx to rx its that simple
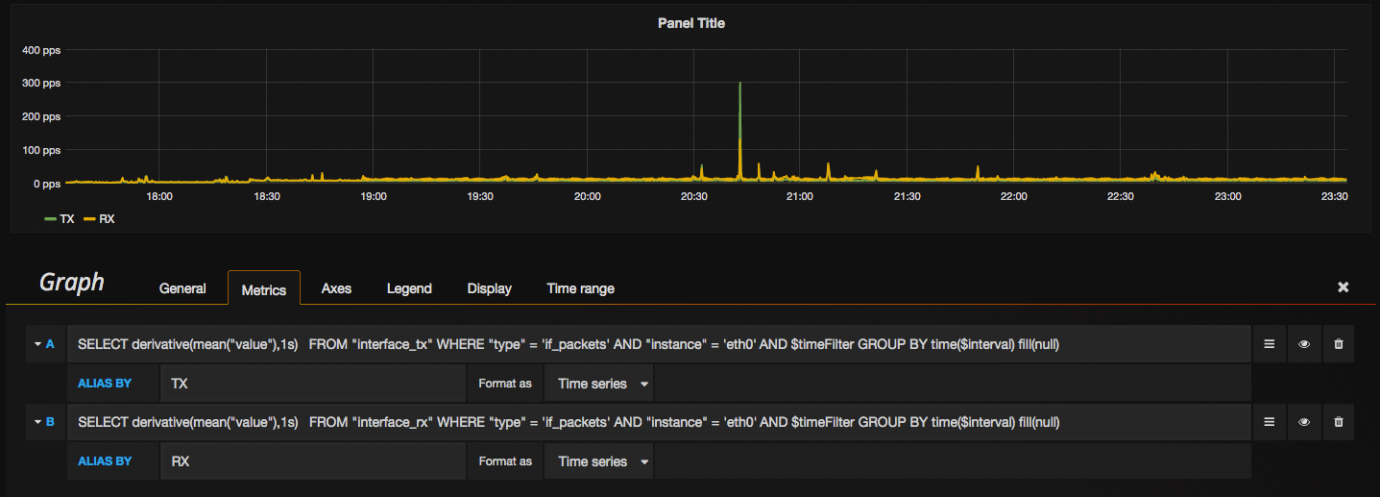
Now that is looking pretty good and shows how under utillised my web server really is, but a nice finishing touch would be to go to the general tab and give your new panel a name thats not 'Panel Title' as that is not very decriptive.
Now simply click the litle x in the corner to go back to your dashboard and you now have your first panel, so now be sure to save your dashboard so the changes stick.
Thats going to be it for this guide colectd is super simple to configure so feel free to go modify the config to add cpu usage, disk usage or SNMP support for getting stats from network switches and routers or really any device, you will be surprised what devices support SNMP.
you will not need to re-add the data source simply add more panels and change the queries to point to the new data you want to display, once you have one panel setup it becomes really easy to add a more panels for all the data you want.
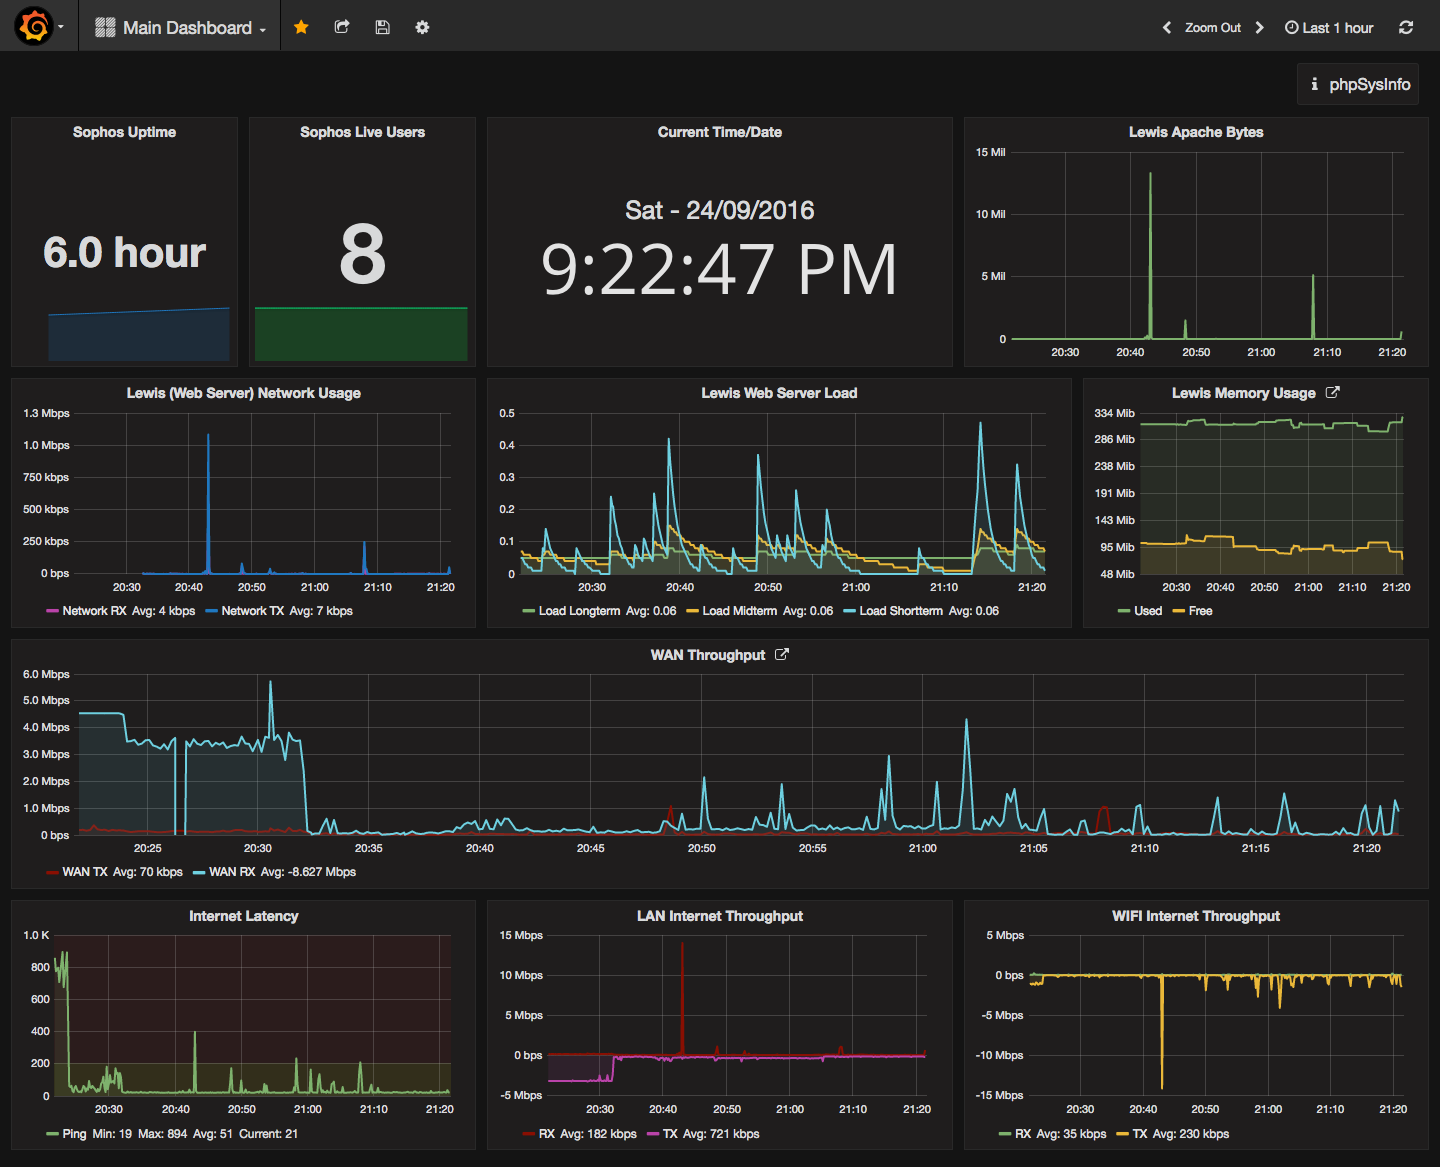
I will leave you with a picture of my WIP dashboard, I will probably be doing a post on the /r/homelab subreddit about it so if you have any comments be sure to head over there https://www.reddit.com/r/homelab/comments/54cl0h/stupid_simple_grafana/